In 2009 WaterSmart Software was born around a simple question: Can social comparisons drive an improvement in water-use efficiency? It turns out the answer to that question was decidedly YES! Over the next several years WaterSmart became a pioneer in the practice that is now broadly known as Behavioral Water Efficiency. By providing water customers with information on how their water use compares with similar households along with specific, money saving recommendations on how they can more effectively use water, utilities see an increase in water-use efficiency of up to 5%.
Since that modest start, WaterSmart has expanded its reach to manage the data of more than 4 million customer accounts. In addition, our technology platform has grown to encompass a full suite of customer self-service and engagement capabilities, in addition to our legacy demand management programs.
As the complexity of our systems increased, we began to dig deeper into our breadth of data to better understand how our utility partners behaved, and what we could do to provide more value to them through our technology platform. This led to the development of internal benchmarking tools that allowed us to rank the relative health of our customers. How many staff members use the system? How many end-users register for the customer portal? What features receive the most use and which receive the least? What are the characteristics of utilities most likely to renew their annual subscription and which accounts are deemed most at risk?
These were natural questions to ask, and since we had access to all the data, it made sense to invest in building tools that would help our customer success, sales, and product marketing teams better serve our customers and help continue to grow our business.
Concurrently, we had been fielding questions from many of our utility customers about how they compared to their peers across a variety of operational, financial, and customer service dimensions. They were interested in understanding if they were more or less efficient in their water use, or if customers were adopting digital technologies more slowly than other communities, or if their meter failure rates were on par with similar suppliers. They would even ask how their internal performance on a particular metric had changed over time as it was often difficult for utilities to perform any longitudinal analysis or historical trending on their own data.
“We had been fielding questions from many of our utility customers about how they compared to their peers across a variety of operational, financial, and customer service dimensions.”
We would occasionally run custom queries for these customers to give them a quick report on how they performed against a specific data-set. Our customers were delighted to get access to data insights that were previously hidden and wondered aloud if we could make this data accessible on an ongoing basis.
So, we did. We took the work we had done for our internal tracking tools and pointed a new analytical lens at a different set of questions. Once we started digging into this data and speaking with our customers, we found many other opportunities to expand the capabilities of these comparisons, and recognized that there were a plethora of use-cases that we had never considered before, but were clearly valuable to our customers.
Our customers wanted to not only compare themselves to their peers on a normalized basis, but they wanted to track their performance over time against established internal benchmarks. They wanted easy-to-use reporting tools so that they could communicate their progress with boards and council members. They wanted to identify areas where improvement was happening quickly and where it was stalling. And they wanted to better understand best-practices used by the most successful suppliers in their segment in order to improve efficiency and accelerate their pace of innovation.
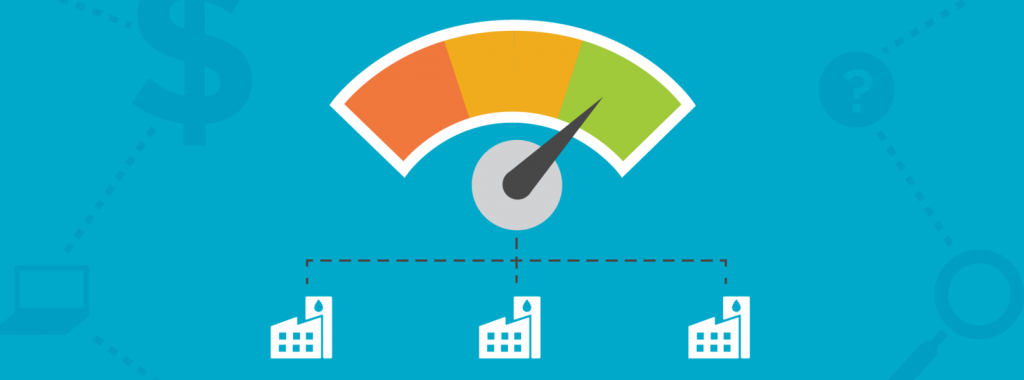
This leads us to the incredibly exciting announcement of Performance WaterMark, an innovative new data benchmarking solution for water utilities. Water utility managers get real-time insights into organizational performance over time and a comparative, normalized score relative to all WaterSmart utility partners. By anonymously aggregating key performance data, water managers now have access to an easy-to-understand performance score across a variety of aspects of their operations to inform goal setting, performance tracking, and reporting to oversight stakeholders.
We’re starting with a limited list of analytic modules most requested by our customers, but the beauty of the system is its scalability based on our massive database of information across well over 100 water suppliers from the past 10 years. We want to hear from you about what you would find valuable and how to turn these insights into tactics that can be employed to mimic the best practices of leading purveyors. Given the historical fragmentation of the water industry in the United States, this massive aggregation of data for benchmarking and tracking is a revelation, and it also happens to be core to the founding mission of WaterSmart Software. We’ve come a long way in the past 10 years, but it’s nice to see things come full circle from asking end-use customers, to now asking our utility partners, how do you compare?


